The mean speed in kilometres per hour and knots of all the combined shipping transits that traverse each grid cell and the number of transits within 4 (5 to 10, 10 to 15, 15 to 20 and 20knts and above) speed classifications. The shipping transits were calculated from the AIS dynamic point data which was recorded from an antenna located at 4430°N and 8.45°E between May 2013 and October 2014. Both shape files were created in spatial reference system EPSG: 3035, so that the number of transits and the attributes of the transits could be summarized into each cell in a GIS platform using spatial analysis.
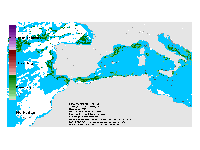
The main shipping routes located in the Pelagos Sanctuary. The routes were primarily identified using a 1km spatial resolution shipping density grid combined with admiralty charts and other maps. The shipping density was calculated from the AIS dynamic point data which was recorded from an antenna located at 4430°N and 8.45°E between May 2013 and October 2014. Areas of localized high shipping density relative to the surrounding sea that displayed a distinct linear distribution were considered as shipping routes. They were found by displaying the total shipping density under natural jenks divisions overlaid the current knowledge of shipping routes covering the North West Mediterranean Sea. The shipping lane shapefile was created in a GIS platform, additional information was sourced from AIS data and geometric processing on a routes destination and length with a spatial reference EPSG: 3035.
Data is likely to be updated according to methodological changes.
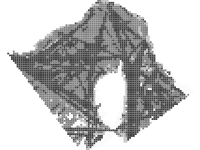
Density of fishing vessel transits, expressed in kilometres per squared kilometres, within the spatial reference EPSG:3035 and including the INSPIRE compliant cell identifier. Transit distance was calculated from the CIMA Foundations AIS dynamic point data which was recorded from an antennae located at 44.30°N and 8.45°E between May 2013 and October 2014. After an initial preparation, cleaning and filtering procedure, a GIS platform was used to create line transits from the positional points for each unique vessel for each day. The length of the transits were then summed within each grid cell for total and monthly composites covering the North West Mediterranean Sea.
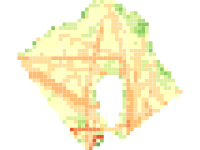
Predominant ship speed categories plot on a INSPIRE compliant grid including the cell identifier and using the spatial reference EPSG: 3035 at 5km spatial resolution. Classifications were to 4 speed categories (5-10, 10-15, 15-20 and 20 knots plus) were attributed for each cell according to the speed category with the highest relative vessel density. Vessel density expressed in kilometres per square kilometre were calculated from the CIMA foundations AIS dynamic point data which was recorded from an antennae located at 44.30°N and 8.45°E between May 2013 and October 2014. After an initial preparation, cleaning and speed classification filtering procedure a GIS platform was used to create line transits from the positional points for each unique vessel for each day. The length of the transits for each speed classification of all pleasure, passenger, cargo and tanker vessels were then summed and the grid cell classified to the speed category with the highest density.